


The Central Bureau of Statistics presents the most important findings for the Foreign Trade of the 3rd quarter 2022.

Total Import
The total import, in terms of weight, registered an increase of 49.6 mln. kg (42.6%) in the third quarter of 2022 (166.1 mln. kg) compared to the same period in 2021 (116.5 mln. kg), while, in terms of value, the total import increased by Afl. 85.6 mln (14.6%), from Afl. 586.8 mln. to Afl. 672.4 mln.
Import to the free circulation area of Aruba* (weight)
Import to the free circulation area of Aruba, in terms of weight, registered an increase of 49.8 mln. kg (43.7%) in the third quarter of 2022 (163.7 mln. kg), compared to the same period in 2021 (113.9 mln. kg). During this period, fifteen (15) of the twenty-one (21) sections registered increases in terms of weight in import to the free circulation area of Aruba. The increase in import to the free circulation area of Aruba (weight) was mainly due to an increase of 51.1 mln. kg (105.7%) in the section “Mineral products”.
The largest decrease was observed in the section “Miscellaneous manufactured articles”, with a decrease of 2.6 mln. kg (-50.8%).
Import to the free circulation area of Aruba* (value)
Import to the free circulation area of Aruba, in terms of value, registered an increase of Afl. 89.3 mln. (16.3%) in the third quarter of 2022 (Afl. 638.9 mln.) compared to the same period in 2021 (Afl. 549.6 mln.). During this period, fifteen (15) sections registered increases in terms of value in import to the free circulation area of Aruba. The increase in import to the free circulation area of Aruba (value) was mainly due to increases of Afl. 26.0 mln. (75.3%) and Afl. 20.8 (33.6%) mln. in the sections “Mineral products” and “Machinery & electrotechnical equipment (new & renewed)”, respectively.
The largest decrease was observed in the section “Miscellaneous manufactured articles”, with decrease of Afl. 7.8 mln. (-18.2%), respectively.
Import to the free Zone of Aruba
Import to the free Zone of Aruba, in terms of weight, registered a decrease of -0.2 mln. kg (-5.8%) in the third quarter of 2022 (2.4 mln. kg) compared to the same period in 2021 (2.6 mln. kg) and was mainly due to a decrease of 0.1 mln. kg (-5.4%) in the section “Food products”.
In terms of value, the import to the free Zone of Aruba decreased by Afl. 3.7 mln (-10.0%) from Afl. 37.2 mln. to Afl.
33.5 mln and was mainly due to a decrease of Afl. 3.5 mln. (-9.6%) in the section “Food products”.
The abovementioned Import (to the free calculation area of Aruba) is the result of Import by Sea and Import by Air, which had the following developments:
- Import to the free circulation area of Aruba* by Sea
Import by Sea to the free circulation area of Aruba, in terms of weight, registered an increase of 50.0 mln. kg (44.3%) in the third quarter of 2022 (163.0 mln. kg) compared to the same period in 2021 (113.0 mln. kg) and was mainly due to an increase of 51.1 mln. kg (105.7%) in the section “Mineral products”.
In terms of value, the import by Sea increased by Afl. 78.2 mln. (17.1%) from Afl. 458.8 mln. to Afl. 537.1 mln and was mainly due to increases of Afl. 26.0 mln. (75.4%) and Afl. 16.8 mln. (32.8%) in the sections “Mineral products” and “Machinery & electrotechnical equipment (new & renewed)”, respectively.
- Import to the free circulation area of Aruba* by Air
Import by Air to the free circulation area of Aruba, in terms of weight, decreased by 0.2 mln. kg (-25.5%) from 1.0 mln. kg in the third quarter of 2021 to 0.7 mln. kg in the third quarter of 2022 and was mainly due to a decrease of each 0.1 mln. kg in the sections “Vegetable products” and “Food products”.
In terms of value, the import by Air increased by Afl. 11.1 mln. (12.2%) from Afl. 90.8 mln. to Afl. 101.8 mln and was mainly due to an increase of Afl. 4.8 mln. (36.1%) in the section “Real pearls (natural) and other precious stones”.
Import to the free circulation area of Aruba* by Large companies**
Import by “Large companies”, in terms of weight, decreased by 2.1 mln. kg (-8.3%) from 25.6 mln. kg in the third quarter of 2021 to 23.4 mln. kg in the third quarter of 2022 and was mainly due to a decrease of 1.8 mln. kg (-7.3%) in the section “Mineral products”.
In terms of value, the import by “Large companies” increased by Afl. 27.1 mln. (62.2%) from Afl. 43.6 mln. to Afl.
70.7 mln and was mainly due to an increase of Afl. 21.5 mln. (72.2%) in the section “Mineral products”.
- Free circulation area of Aruba: all goods entering or leaving the economic territory of Aruba, excluding the Free Zone
- Large companies refers to the following companies: Valero, Arugas, Web, Elmar and Setar
THIRD QUARTER 2022

FOREIGN TRADE
| IMPORT | mln. kg | % change | |||
| To Aruba by Sea | ↑ | 50.0 | 44.3 | ||
| To Aruba by Air | ↓ | -0.2 | -25.5 | ||
| To Aruba | ↑ | 49.8 | 43.7 | ||
| To the Free Zone | ↓ | -0.2 | -5.8 | ||
| Total Import | ↑ | 49.6 | 42.6 | ||
| By Large companies* | ↓ | -2.1 | -8.3 | ||
| IMPORT | mln. Afl. | % change | |||
| To Aruba by Sea | ↑ | 78.2 | 17.1 | ||
| To Aruba by Air | ↑ | 11.1 | 12.2 | ||
| To Aruba | ↑ | 89.3 | 16.3 | ||
| To the Free Zone | ↓ | -3.7 | -10.0 | ||
| Total Import | ↑ | 85.6 | 14.6 | ||
| By Large companies* | ↑ | 27.1 | 62.2 | ||
| EXPORT | mln. kg | % change | |||
| From Aruba by Sea | ↓ | -2.4 | -29.8 | ||
| From Aruba by Air | ↑ | 0.0 | 8.7 | ||
| From Aruba | ↓ | -2.4 | -29.6 | ||
| From the Free Zone | ↓ | -0.1 | -2.8 | ||
| Total Export | ↓ | -2.5 | -23.7 | ||
| By Large companies* | ↑ | 0.0 | 187,331.6 | ||
| EXPORT | mln. Afl. | % change | |||
| From Aruba by Sea | ↑ | 4.0 | 48.9 | ||
| From Aruba by Air | ↑ | 0.1 | 2.1 | ||
| From Aruba | ↑ | 4.2 | 28.9 | ||
| From the Free Zone | ↓ | -1.1 | -3.5 | ||
| Total Export | ↑ | 3.1 | 6.8 | ||
| By Large companies* | ↑ | 0.0 | 8,019.0 | ||
The % change is determined by comparing the
3rd quarter of 2021 with the 3rd quarter of 2022.
*Large companies refers to the following companies:
Valero, Arugas, Web, Elmar and Setar
Total Export
The total export, in terms of weight, registered a decrease of 2.5 mln. kg (-23.7%) in the third quarter of 2022 (7.9 mln. kg) compared to the same period of 2021 (10.3 mln. kg), while, in terms of value, the total export increased by Afl. 3.1 mln. (6.8%) from Afl. 45.4 mln. to Afl. 48.5 mln.
Export from the free circulation area of Aruba* (weight)
Export from the free circulation area of Aruba, in terms of weight, registered a decrease of 2.4 mln. kg (-29.6%) in the third quarter of 2022 (5.7 mln. kg) compared to the same period in 2021 (8.1 mln. kg). Eleven (11) of the twenty-one (21) sections, registered decreases in terms of weight in the export from the free circulation area of Aruba. The decrease in export from the free circulation area of Aruba (weight) was mainly due to a decrease of 2.2 mln. kg (-46.4%) in the section “Base metals and derivated works”.
The largest increase was observed in the section “Food products”, with an increase of 0.4 mln. kg (149.2%).
Export from the free circulation area of Aruba* (value)
Export from the free circulation area of Aruba, in terms of value, registered an increase of Afl 4.2 mln. (28.9%) in the third quarter of 2022 (Afl. 18.6 mln.) compared to the same period in 2021 (Afl. 14.4 mln.). Fourteen (14) of the twenty-one (21) sections, registered increases in terms of value in the export from the free circulation area of Aruba. The increase in export from the free circulation area of Aruba (value) was mainly due to increases of Afl. 2.8 mln. (328.2%) and Afl. 1.3 mln. (98.6% )in the sections “Machinery & electrotechnical equipment (new & renewed)” and “Base metals and derivated works”, respectively.
The largest decrease was observed in the section “Chemical products”, with a decrease of Afl. 1.3 mln. (-47.3%).
Export from the free Zone of Aruba
Export from the free Zone of Aruba, in terms of weight, registered a decrease of 0.1 mln. kg (-2.8%) in the third quarter of 2022 (2.2 mln. kg) compared to the same period in 2021 (2.3 mln. kg) and was mainly due to a decrease of 0.1 mln. kg (-3.0%) in the section “Food products”.
In terms of value, the export from the free Zone of Aruba decreased by Afl. 1.1 mln. (-3.5%) from Afl. 31.0 mln. to Afl. 29.9 mln. and was mainly due to a decrease of Afl. 1.1 mln. (-3.6%) in the section “Food products”.
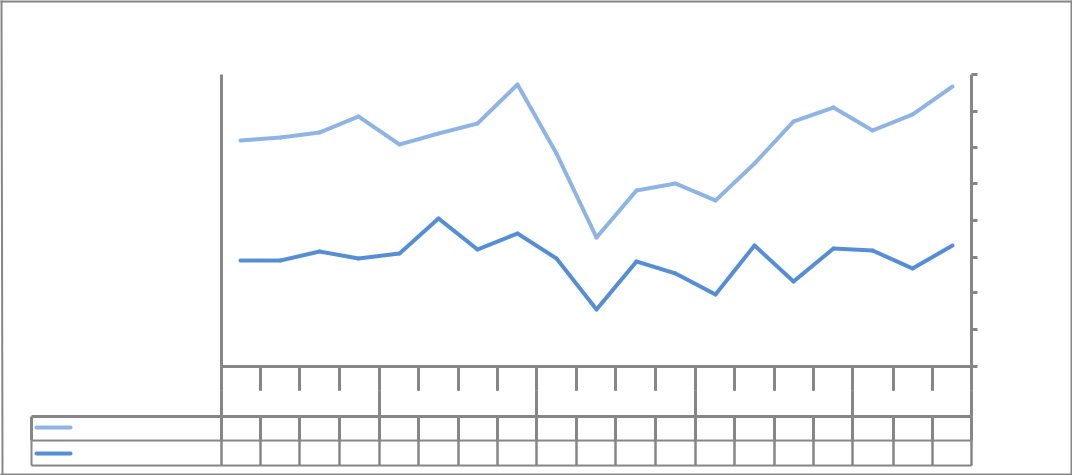
| Total Import by quarter, 2018-2022 | |||||||||||||||||||||
| 700 | 400 | ||||||||||||||||||||
| 600 | 350 | ||||||||||||||||||||
| 500 | 300 | ||||||||||||||||||||
| Afl | 400 | 250 | kg | ||||||||||||||||||
| mln. | 200 | mln. | |||||||||||||||||||
| 300 | 150 | ||||||||||||||||||||
| 200 | 100 | ||||||||||||||||||||
| 100 | 50 | ||||||||||||||||||||
| 0 | 1 | 2 | 3 | 4 | 1 | 2 | 3 | 4 | 1 | 2 | 3 | 4 | 1 | 2 | 3 | 4 | 1 | 2 | 0 | ||
| 3 | |||||||||||||||||||||
| 2018 | 2019 | 2020 | 2021 | 2022 | |||||||||||||||||
| Total Import (mln. Afl) 540.7 547.3 561.4 598.8 534.2 557.7 583.2 676.7 509.5 309.2 422.4 438.7 397.7 486.5 586.8 621.5 565.1 605.3 672.4 | |||||||||||||||||||||
| Total Import (mln. kg) | 145.1 144.9 157.7 147.9 154.5 203.4 159.8 182.5 148.4 77.4 143.8 127.8 99.0 165.7 116.5 161.2 158.9 134.0 166.1 | ||||||||||||||||||||
Total Export by quarter, 2018-2022
| 60 | 20 | ||||||||||||||||||||
| 18 | |||||||||||||||||||||
| 50 | 16 | ||||||||||||||||||||
| 40 | 14 | ||||||||||||||||||||
| Afl | kg | ||||||||||||||||||||
| 12 | |||||||||||||||||||||
| mln. | 30 | 10 | mln. | ||||||||||||||||||
| 8 | |||||||||||||||||||||
| 20 | 6 | ||||||||||||||||||||
| 10 | 4 | ||||||||||||||||||||
| 2 | |||||||||||||||||||||
| 0 | 1 | 2 | 3 | 4 | 1 | 2 | 3 | 4 | 1 | 2 | 3 | 4 | 1 | 2 | 3 | 4 | 1 | 2 | 0 | ||
| 3 | |||||||||||||||||||||
| 2018 | 2019 | 2020 | 2021 | 2022 | |||||||||||||||||
| Total Export (mln. Afl) | 31.0 | 29.4 | 29.8 | 34.2 | 31.6 | 40.4 | 34.1 | 34.7 26.2 21.0 36.1 34.7 21.6 46.6 45.4 44.3 38.5 50.5 48.5 | |||||||||||||
Total Export (mln. kg) 4.5 4.8 4.6 5.4 5.0 6.1 4.7 5.3 4.9 4.2 5.0 5.5 4.9 6.7 10.3 7.2 7.2 7.1 7.9
| L.G. Smith Boulevard 160 I Oranjestad, Aruba I Tel: +297 5247433 I Fax: +297 5838057 I www.cbs.aw I November 11, 2022 | 2 |
Table 1 Import by quarter, 2021-2022
| 3rd Quarter | ||||||||||||
| Qtr. 2021 | Qtr. 2022 | 2021 – 2022 | ||||||||||
| in mln. kg | 1st | 2nd | 3rd | 4th | 2020 | 1st | 2nd | 3rd | 4th | 2021 | % change | in mln |
| To Aruba by Sea | 96.8 | 163.1 | 113.0 | 158.2 | 531.0 | 156.1 | 130.4 | 163.0 | 0.0 | 449.4 | 44.3 | 50.0 |
| To Aruba by Air | 0.6 | 0.6 | 1.0 | 0.8 | 3.1 | 0.7 | 0.7 | 0.7 | 0.0 | 2.1 | -25.5 | -0.2 |
| To Aruba | 97.4 | 163.7 | 113.9 | 159.0 | 534.1 | 156.8 | 131.0 | 163.7 | 0.0 | 451.5 | 43.7 | 49.8 |
| To the Free Zone | 1.6 | 2.0 | 2.6 | 2.2 | 8.4 | 2.1 | 3.0 | 2.4 | 0.0 | 7.6 | -5.8 | -0.2 |
| Total Import | 99.0 | 165.7 | 116.5 | 161.2 | 542.4 | 158.9 | 134.0 | 166.1 | 0.0 | 459.1 | 42.6 | 49.6 |
| By Large companies | 20.1 | 21.2 | 25.6 | 23.8 | 90.6 | 22.5 | 24.8 | 23.4 | 0.0 | 70.8 | -8.3 | -2.1 |
| By Other companies | 77.3 | 142.6 | 88.4 | 135.2 | 443.4 | 134.3 | 106.2 | 140.3 | 0.0 | 380.8 | 58.8 | 51.9 |
| To Aruba | 97.4 | 163.7 | 113.9 | 159.0 | 534.1 | 156.8 | 131.0 | 163.7 | 0.0 | 451.5 | 43.7 | 49.8 |
| in mln. Afl. | ||||||||||||
| To Aruba by Sea | 312.6 | 369.1 | 458.8 | 477.2 | 1,617.8 | 436.6 | 462.9 | 537.1 | 0.0 | 1,436.5 | 17.1 | 78.2 |
| To Aruba by Air | 68.7 | 91.6 | 90.8 | 113.5 | 364.6 | 99.2 | 107.3 | 101.8 | 0.0 | 308.3 | 12.2 | 11.1 |
| To Aruba | 381.3 | 460.8 | 549.6 | 590.8 | 1,982.5 | 535.8 | 570.2 | 638.9 | 0.0 | 1,744.8 | 16.3 | 89.3 |
| To the Free Zone | 16.4 | 25.8 | 37.2 | 30.7 | 110.1 | 29.3 | 35.1 | 33.5 | 0.0 | 97.9 | -10.0 | -3.7 |
| Total Import | 397.7 | 486.5 | 586.8 | 621.5 | 2,092.5 | 565.1 | 605.3 | 672.4 | 0.0 | 1,842.8 | 14.6 | 85.6 |
| By Large companies | 39.7 | 39.3 | 43.6 | 46.5 | 169.1 | 59.0 | 55.2 | 70.7 | 0.0 | 184.9 | 62.2 | 27.1 |
| By Other companies | 341.6 | 421.5 | 506.0 | 544.3 | 1,813.4 | 476.8 | 514.9 | 568.2 | 0.0 | 1,559.9 | 12.3 | 62.2 |
| To Aruba | 381.3 | 460.8 | 549.6 | 590.8 | 1,982.5 | 535.8 | 570.2 | 638.9 | 0.0 | 1,744.8 | 16.3 | 89.3 |


Source: Central Bureau of Statistics Aruba
Table 2 Export by quarter, 2021-2022
| 3rd Quarter | ||||||||||||
| Qtr. 2021 | Qtr. 2022 | 2021 – 2022 | ||||||||||
| in mln. kg | 1st | 2nd | 3rd | 4th | 2020 | 1st | 2nd | 3rd | 4th | 2021 | % change | in mln |
| From Aruba by Sea | 3.9 | 4.7 | 8.0 | 4.8 | 21.4 | 5.2 | 4.6 | 5.6 | 0.0 | 15.4 | -29.8 | -2.4 |
| From Aruba by Air | 0.0 | 0.0 | 0.0 | 0.1 | 0.2 | 0.0 | 0.0 | 0.0 | 0.0 | 0.1 | 8.7 | 0.0 |
| From Aruba | 3.9 | 4.74 | 8.1 | 4.9 | 21.6 | 5.2 | 4.68 | 5.7 | 0.0 | 15.6 | -29.6 | -2.4 |
| From the Free Zone | 1.0 | 2.0 | 2.3 | 2.3 | 7.6 | 2.0 | 2.4 | 2.2 | 0.0 | 6.6 | -2.8 | -0.1 |
| Total Export | 4.9 | 6.7 | 10.3 | 7.2 | 29.2 | 7.2 | 7.1 | 7.9 | 0.0 | 22.2 | -23.7 | -2.5 |
| By Large companies | 0.0 | 0.0 | 0.0 | 0.0 | 0.1 | 0.0 | 0.0 | 0.0 | 0.0 | 0.0 | 187,331.6 | 0.02 |
| By Other companies | 3.9 | 4.7 | 8.1 | 4.9 | 21.5 | 5.2 | 4.7 | 5.7 | 0.0 | 15.5 | -29.9 | -2.4 |
| From Aruba | 3.9 | 4.7 | 8.1 | 4.9 | 21.6 | 5.2 | 4.7 | 5.7 | 0.0 | 15.6 | -29.6 | -2.4 |
| in mln. Afl. | ||||||||||||
| From Aruba by Sea | 6.6 | 9.0 | 8.3 | 6.8 | 30.6 | 8.1 | 10.4 | 12.3 | 0.0 | 30.9 | 48.9 | 4.0 |
| From Aruba by Air | 5.2 | 11.1 | 6.1 | 5.7 | 28.2 | 5.2 | 8.3 | 6.3 | 0.0 | 19.8 | 2.1 | 0.1 |
| From Aruba | 11.8 | 20.1 | 14.4 | 12.5 | 58.8 | 13.4 | 18.7 | 18.6 | 0.0 | 50.7 | 28.9 | 4.2 |
| From the Free Zone | 9.7 | 26.5 | 31.0 | 31.8 | 99.0 | 25.2 | 31.8 | 29.9 | 0.0 | 86.8 | -3.5 | -1.1 |
| Total Export | 21.6 | 46.6 | 45.4 | 44.3 | 157.8 | 38.5 | 50.5 | 48.5 | 0.0 | 137.5 | 6.8 | 3.1 |
| By Large companies | 0.0 | 0.3 | 0.0 | 0.0 | 0.3 | 0.0 | 0.0 | 0.0 | 0.0 | 0.1 | 8,019.0 | 0.0 |
| By Other companies | 11.8 | 19.8 | 14.4 | 12.5 | 58.4 | 13.4 | 18.7 | 18.5 | 0.0 | 50.6 | 28.7 | 4.1 |
| From Aruba | 11.8 | 20.1 | 14.4 | 12.5 | 58.8 | 13.4 | 18.7 | 18.6 | 0.0 | 50.7 | 28.9 | 4.2 |


Source: Central Bureau of Statistics Aruba
| 3 | |


