(Oranjestad)—Every quarter, the Central Bank of Aruba observes the Tourism Receipts (or Tourism Credits), which shows the amount of money brought in by tourism. The Aruba Tourism Authority (A.T.A) had set the goal to recover with 95% in this economic indicator for 2022. Recently, the Central Bank has published the latest figures from the last quarter in 2022. This illustrates a recovery by 118% in Tourism Receipts in 2022 compared to 2019.
The importance of this indicator in terms of the recovery in the island’s tourism must be emphasized, seeing as this is one of the indicators that does not illustrate the number of visitors to Aruba, but the amount of money generated through these visits. Tourism Receipts is the direct profit generated through tourism and excludes the indirect income that Aruba’s economy generated thanks to the tourist industry.
March 2023 compared to 2019 and 2022
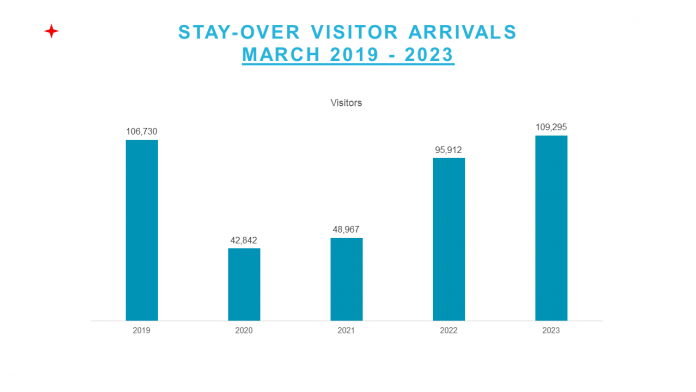
In the month of March 3023, the island received a total of 109,295 stay-over visitors. Comparing this to March 2019—which was the last normal year for tourism before the pandemic, it can be concluded that Aruba recovered 102% of its profits from March 2019, which indicates a growth of 2%. When comparing March 2023 with March 2022, the recovery rate is at 114%, illustrating a growth of 14%.
Markets and categories of accommodation
In March of this year, 84.8% of the total stay-over visitors on Aruba came from North America, 5.7% from Europe, 7.2% from Latino America and 2.3% came from other parts of the world. Looking at the categories of accommodation, March 2023 saw 36.6% of visitors who stayed in High-Rise hotels. 8.9% stayed in Low-Rise hotels, 25.2% stayed in Timeshares and 29.3% stayed in other types of accommodation, also known as vacation rentals.
Vacation Rentals
Is it important to mention that A.T.A has access to a platform where the number of houses, apartments and villas used as vacation rentals, as well as the average price per night for these accommodations can be seen. Furthermore, A.T.A also has access on the same platform to an overview of the occupation of these vacation rentals and the profit that these generate.
When comparing March 2023 with March 2022, the figures show that the average price for this type of accommodation grew by 12%; from the average price of $237 per night in March 2022 to an average price of $266 per night in 2023. When comparing March 2023 with March 2029, figures show that the average price for vacation rentals grew by 45%; from an average price of $184 per night in March 2019 to $266 in March 2023.
Comparisons of March 2023 and March 2022 also show that the average occupation in vacation rental reduced with 1 percentage point; from an average of 63.7% in March 2022 to an average of 62.7% in 2023. In 2019, the average percentage was 43.6% compared to the 62.7% of March of this year. This shows a growth of 19.1%.
In terms of profit, comparisons between March 2023 and March 2022 show that this category generated a growth by 24%. Comparisons between March 2023 and March 2019 show a growth of 156%.
| Vacation Rentals | |||||
| 2019 | 2020 | 2021 | 2022 | 2023 | |
| ADR | $184.00 | $200.00 | $220.00 | $237.00 | $266.00 |
| Occupancy | 43.6% | 35.6% | 45.6% | 63.7% | 62.7% |
| Revenue | $7,427,712 | $5,312,008 | $8,819,847 | $15,317,752 | $18,982,857 |
| Source: A.T.A. (Transparent) | |||||


